As covered earlier data driven decision making is a powerful tool as it eliminates guess work and decision making based on rules of thumb. It provides an evidence-based approach and confidence when making business decisions.
In today’s blog we will be discussing the application of this concept in:
- Power Generation forecasting
- Supermarkets stock forecasting
Power Generation
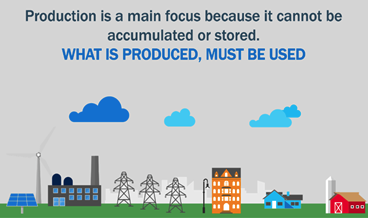
Once power is generated, it can’t be cost effectively stored with today’s technology, so it is either consumed our wasted, and waste means a loss of profitability, increase in greenhouse emissions, energy and resource misuse and depletion (natural gas, thermal coal etc) and an overall sub optimization of operations, strategy and planning.
On the other hand, under production is also not a viable option as it will result in energy shortfalls which will result in black outs or energy rationing, severally disrupting business and society. Therefore, accurate prediction or forecasting of expected demand is of utmost importance, if power generation is to be a viable business
Pirolabs approach to solving this problem is utilizing a cloud centric approach which entails using traditional predictors, (temperature, historical data and other variables) and computing them in the cloud, with artificial intelligence to forecast demand and visualising this data with powerful tools, such as Tableau and Power BI. All in real time and with 95% accuracy. This has the advantage of cost effectiveness and insurance.
Supermarkets
Supply chain management also benefits from demand forecasting. As a retailer or supermarket operator we have to ensure there is adequate supply of produce, so keeping track of manufacturing, storage, transportation and even supplier issues can be challenging.
In addition the challenge of keeping track of stock creates a major problem for supermarkets, too much pork pies and we risk having to sell them at a discount or destroying our stock, too little and we miss on valuable sales.
To solve this problem supermarkets use a combination of methods:
- Simulations: A combination of qualitative, and time series analysis.
Qualitative analysis (This is the use of human intuition, for example, experienced employees to provide their insight into sales trends, and therefore demand trends).
Time series analysis (This is the use of historical data. Previous sales data is used to create models to predict future demand, via use of regression analysis, this also takes into accounts causal factors like seasonality, weather etc, these causal factors can be considered independently also).
- Simulations: A combination of qualitative, and time series analysis. Qualitative analysis (This is the use of human intuition, for example, experienced employees to provide their insight into sales trends, and therefore demand trends). Time series analysis (This is the use of historical data. Previous sales data is used to create models to predict future demand, via use of regression analysis, this also takes into accounts causal factors like seasonality, weather etc, these causal factors can be considered independently also).
- Just in time delivery: Which entails real-time monitoring and ordering of stocks as they are being bought by customers. Orders are sent to manufacturers who deliver goods to supermarket distribution centres (distribution centres are located centrally). A good example is the East Midlands, also known as the Golden triangle the UK, where most distribution centres are located. From here 90% of the UK can be reached in 4 hours. Stock is then shipped to different stores in the UK.
References
Pirolabs-End2End Webinar Series
Vendhq.com- https://www.vendhq.com/blog/how-to-forecast-inventory-demand/ Wired.co.uk.-https://www.wired.co.uk/article/stockpiling-supermarkets-coronavirus#:~:text=Just%2Din%2Dtime%20relies%20on,area%20called%20the%20Golden%20Triangle.
Recent Comments